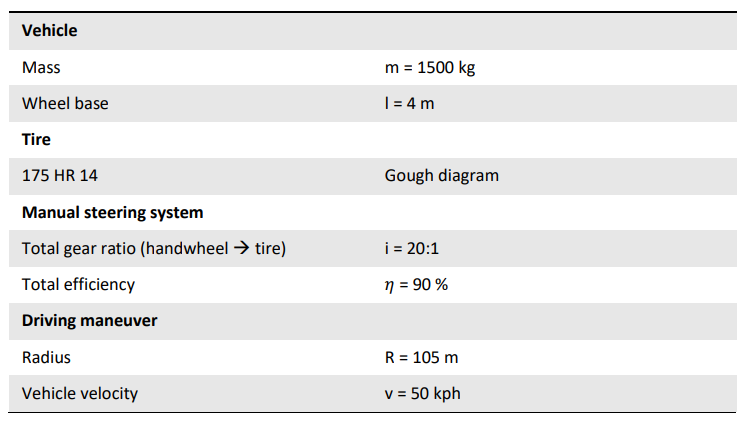
2.0.1 Specifications
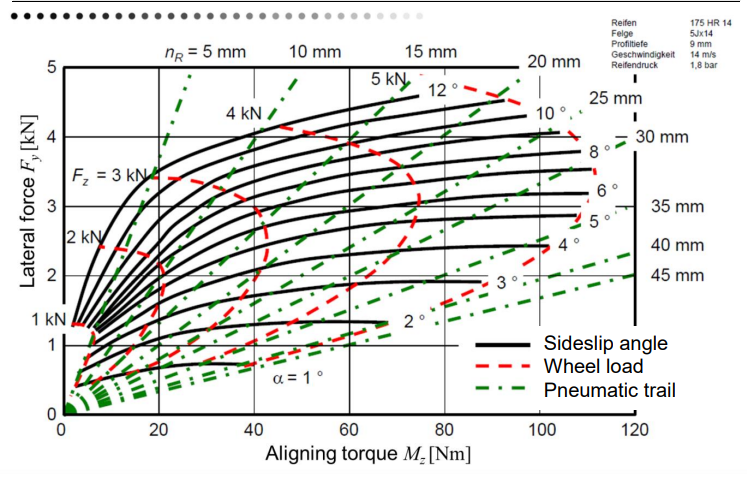
Investigating the uses of the Gough Diagram
2.0.2 175 HR 14 Gough Diagram
2.0.3 Additional Parameters
2.1.0 Methodoloy
Reading values of the Gough diagram to gather a sufficient data set for plotting and calculations
2.1.1 Script and Data Set from Gough Diagram
a = 0:12; % side slip angle[degree]
a2 = -12:12;
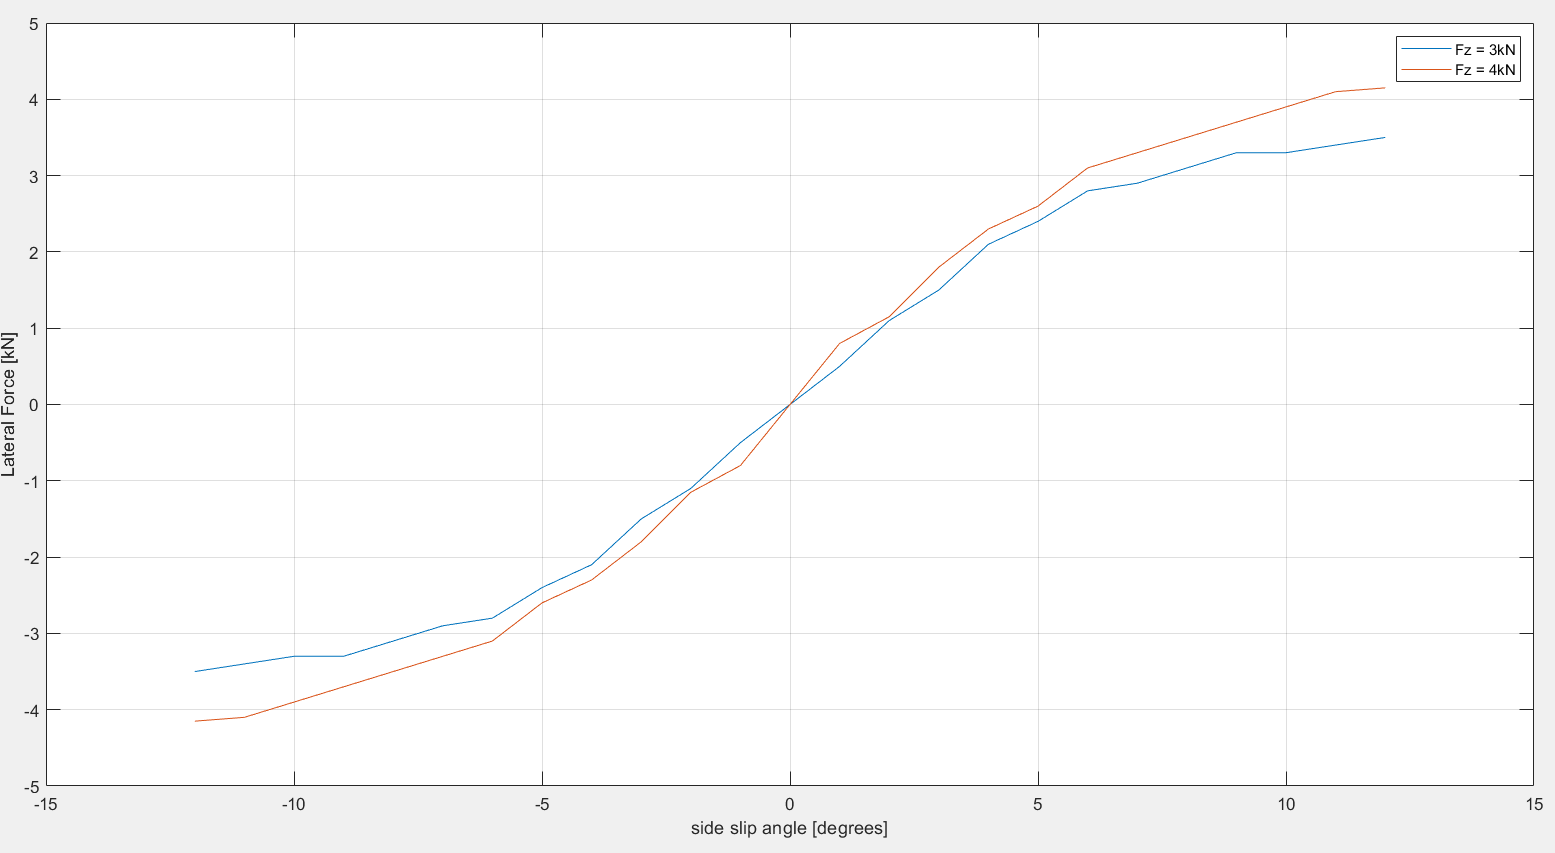
Fy_3 = [0 0.5 1.1 1.5 2.1 2.4 2.8 2.9 3.1 3.3 3.3 3.4 3.5]; % lateral force [kN]
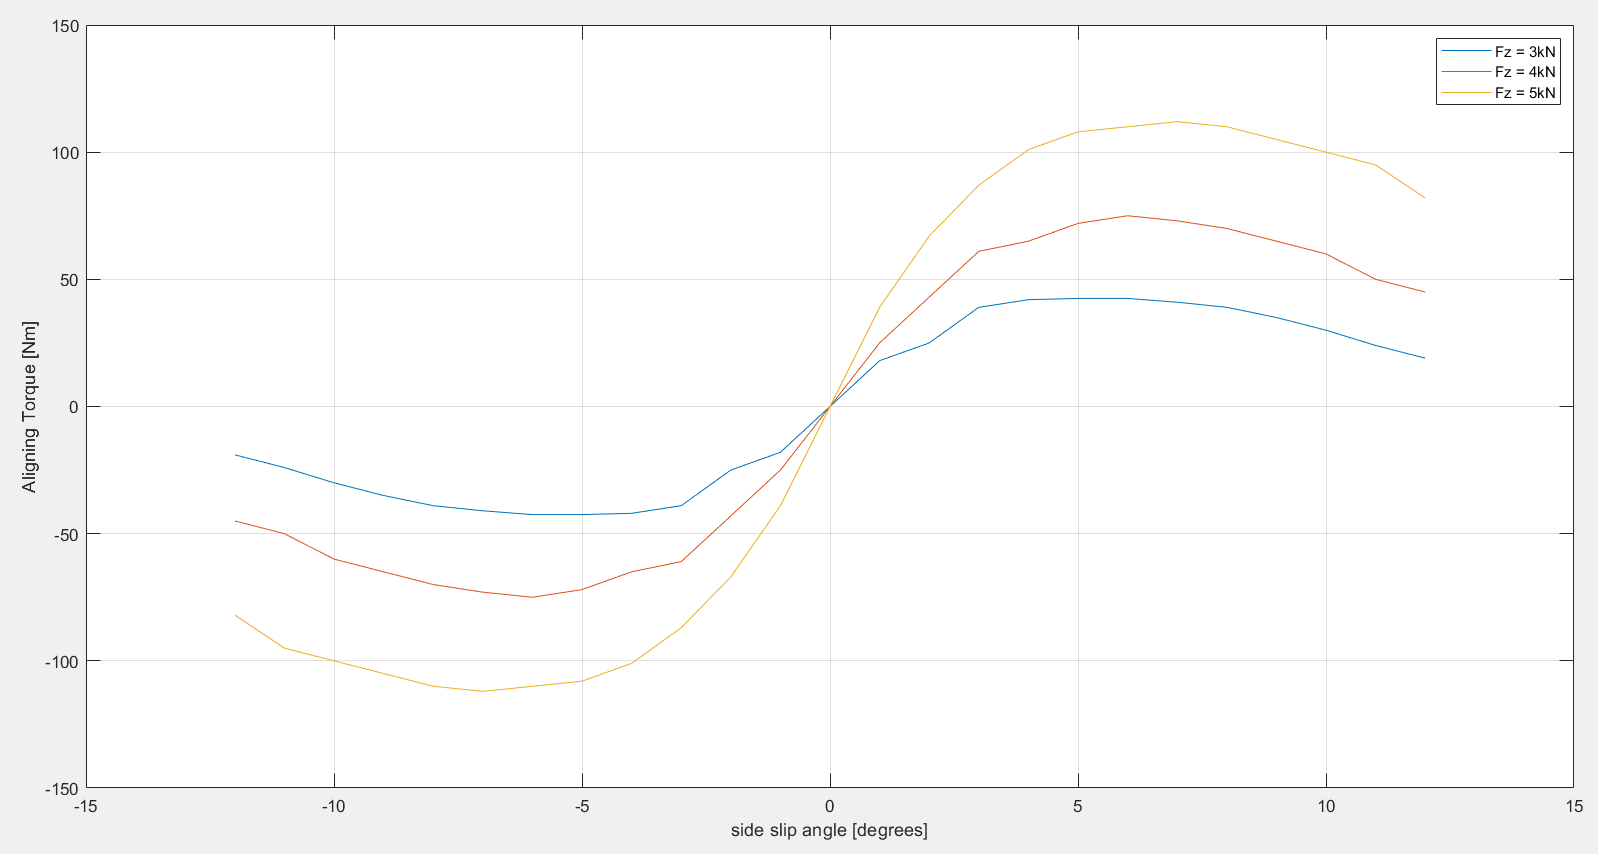
Mz_3 = [18 25 39 42 42.5 42.5 41 39 35 30 24 19]; % aligning torque [Nm]
Fy_4 = [0 0.8 1.15 1.8 2.3 2.6 3.1 3.3 3.5 3.7 3.9 4.1 4.15];
Mz_4 = [25 43 61 65 72 75 73 70 65 60 50 45];
Mz_5 = [39 67 87 101 108 110 112 110 105 100 95 82];
Fy = [-1*flip(Fy_3) Fy_3; ...
-1*flip(Fy_4) Fy_4];
plot(a2,Fy);
xlabel("side slip angle [degrees]")
ylabel("Lateral Force [kN]")
grid
legend("Fz = 3kN","Fz = 4kN")
figure
Mz=[-1*flip(Mz_3) 0 Mz_3; ...
-1*flip(Mz_4) 0 Mz_4; ...
-1*flip(Mz_5) 0 Mz_5];
plot(a2,Mz);
xlabel("side slip angle [degrees]")
ylabel("Aligning Torque [Nm]")
grid
legend("Fz = 3kN","Fz = 4kN","Fz = 5kN")
2.2.0 Graphs of Lateral Force and Alligning Torque